 Patient Data Manager: Information Governance and Data Acquisition in Precision Medicine
The outcomes of machine learning activities are heavily influenced by the data sources they use and it is well known that many demographic groups - relating to sex, age, ethnicity, race and socioeconomic status - are poorly represented in data sources that can inform precision medicine.
The need to improve the diversity of data used in the field is driven by moral, scientific and economic motives. Improvements could be made to many aspects of the drug discovery process, but here we focus on those which could be made to the data acquisition process. Here we outline some possible approaches.
Your disease influences your landscape.
The disease programmes that organisations choose are going to influence the landscape of data sources that can be pursued. For example, if you are going to work on a rare genetic disorder like Hunter's Syndrome, you may encounter few data sources, each with few patients. The disease affects almost exclusively males whose life expectancy then varies between 10 and 20 years of age. In this case, characteristics of disease prevalence may make it difficult to improve the diversity to include a lot more females and patients who are middle-aged or older.
On the other hand, if the disease of interest is more common like prostate cancer, for example, there will be more data sources with more patients represented in them. From the diversity perspective, we know that prostate cancer has a disproportionate incidence and mortality in black male groups compared with white male groups. Yet, most of the participants in prostate cancer trials are white males. In this case, there may be more room to look for more black male groups in many data sources to try and better represent them.
And this is an important lead-in for how to measure how adequately represented demographic groups may be.
Determine how you will assess adequate representation.
Below is a chart that may help guide the metrics you might want to use to measure adequate diversity. Along the top are three different types of data sources: disease agnostic ones (i.e a national biobank), a common disease (i.e a type of cancer) and a rare disease (i.e a rare genetic disorder).
Down the side are demographic attributes. For a biobank, it may make sense to measure these attributes relative to the demographics of the patient areas they service. For common and rare diseases, we would mostly rely on prevalence and consider the demographics of the disease population.
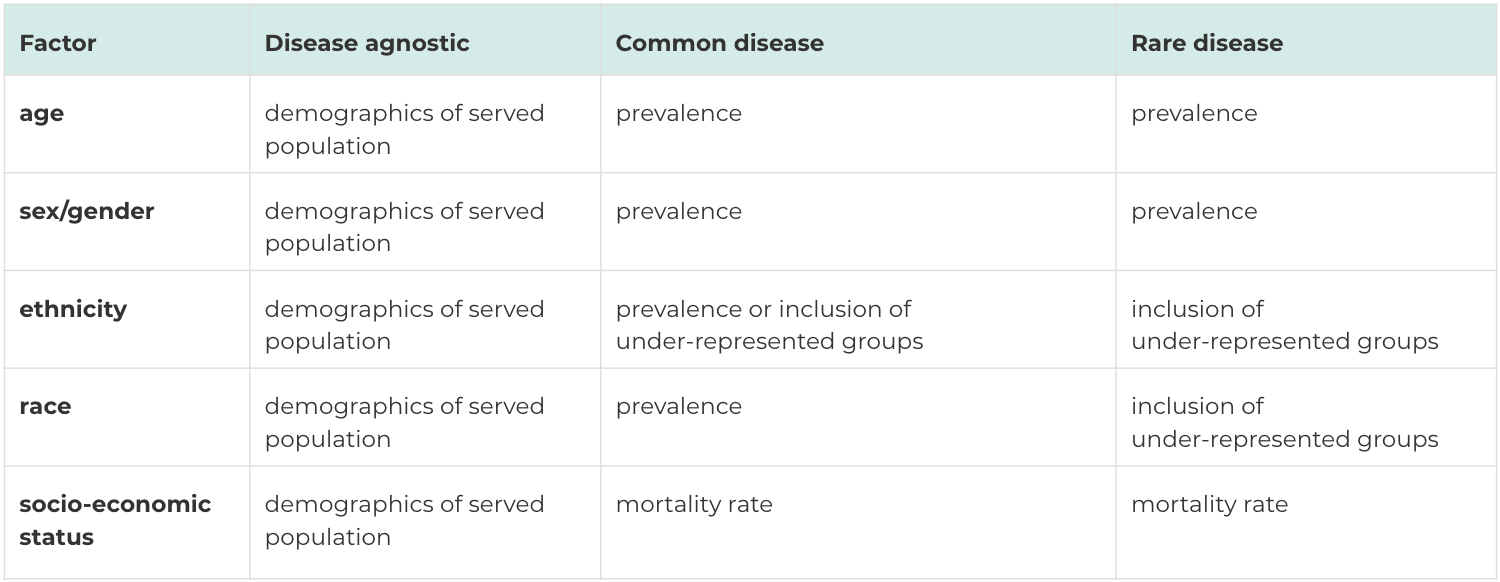
Sometimes, it may not be the case that a disease is not prevalent in a given demographic group, it may be that data is absent, i.e a part of the population is not represented in the data. In those cases, you may want to view an improvement for diversity to mean that you are including people who are typically going to be missing from many of the disease's data sources.
In any case, determining how you will assess adequate representation is important and something to add as part of your process.
Estimating a minimum N.
Suppose the goal is to improve the representation of a particular cross-section of society in the data. In that case, we need to ask: “what is the minimum number of people for a given demographic so that the analyses can generate meaningful results?”
This can be a very challenging question to answer because the minimum sample size can be influenced by many factors. It can depend on the disease, the disease trait, and the frequency of how prevalent that trait appears in a population. It depends on things like the power, the significance level, the number of hypotheses tested, the effect size and the population heterogeneity. Machine learning scientists are concerned about knowing whether a data source has necessary and sufficient data to identify and distinguish a signal from noise for some characteristic of interest.
Initially, the answer won't be a number - but a checklist of things that will help to provide a rough idea of what the N will be. That N will change as your analysis matures but it is useful to revisit it to help make data acquisition a cost-effective activity.
Look for your patients.
After all these steps, this is where you can begin to appreciate all the other factors that you may have to consider alongside diversity.
And you may start asking yourself, is the data answering the scientific questions I am interested in? Is the quality of clinical and molecular data in line with what I am searching for? How quick and easy is the application process for getting data? Are there any intellectual property considerations? How are longitudinal data points distributed across a data source?
Finding diversity in the data landscape for a disease can lead to some new kinds of creative thinking that may not be obvious. For example, if you want to find N patients of a given ethnicity, we need to think globally about where people from a demographic are because it will influence the administrative processes for acquiring data.
Create the demand: Put it in the contract.
When you find a prospective data source you like, ask for the diverse sets of data that include age, sex, ethnicity, race and socioeconomic status a part of a data access contract, along with indicating what you want to do with it. Create demand by specifying it in the contract, and hopefully, this will influence data providers to record that information better in the future.
Test our Diversity Analysis Tool: a simple open-source programme
The codebase we have open-sourced is meant to be simple and provide some basic code examples that may inspire you to develop more sophisticated solutions. We also provide information about common data processing issues that relate to these demographic concepts. The codebase may help you make a better assessment of the diversity in data sets you already work with. It may just help you evaluate the diversity in future health data sets you may encounter. However you may use the code, we hope it encourages you to think more about improving the diversity in data.
The Diversity Analysis Tool is available on Github
Back to blog post and videos