 AI Scientist
Language modelling of electronic health record data
Anna Muñoz Farré explains more about the work she presented at the Workshop on Learning from Time Series for Health at NeurIPS 2022 and its implications for clinical data integration.
Integrating multiple clinical data sources
Integrating and combining multiple clinical data sources can help us to better understand disease. Currently, mappers or phenotype definitions are used, but those rely on manual curation and are prone to error. Moreover, mapping diagnosis terms across sources (for example, from primary to secondary care) imply a loss of information, due to the nature of each. In our paper, we propose a method based on transformers to enable integrated analysis of multiple clinical data sources. Using text descriptions as input, we encode each patient’s medical records, keeping all granularity and information.
The model learns representations of clinical histories from diagnosed patients to predict clinical events. In our case, we are interested in tackling the unsolved problem of missing diagnosis and misdiagnosis in the clinic. To do this, we trained the model to predict disease phenotypes from input sequences in which relevant diagnostic terms were masked (learning from cases with the diagnosis masked). The model can then be used to find potentially un- or misdiagnosed individuals for cohort extension, e.g. to increase the sample size for downstream analysis such as GWAS.
Methods
To generate our input data, we defined each patient’s full clinical history through time and across sources by the concatenation of sequences of clinical descriptions (a patient’s history would be equivalent to a paragraph). To generate our labels, we assigned a binary label to each individual according to the presence or absence of a clinical outcome or event. In our case, we label a patient according to the phenotypes (diseases) they have been
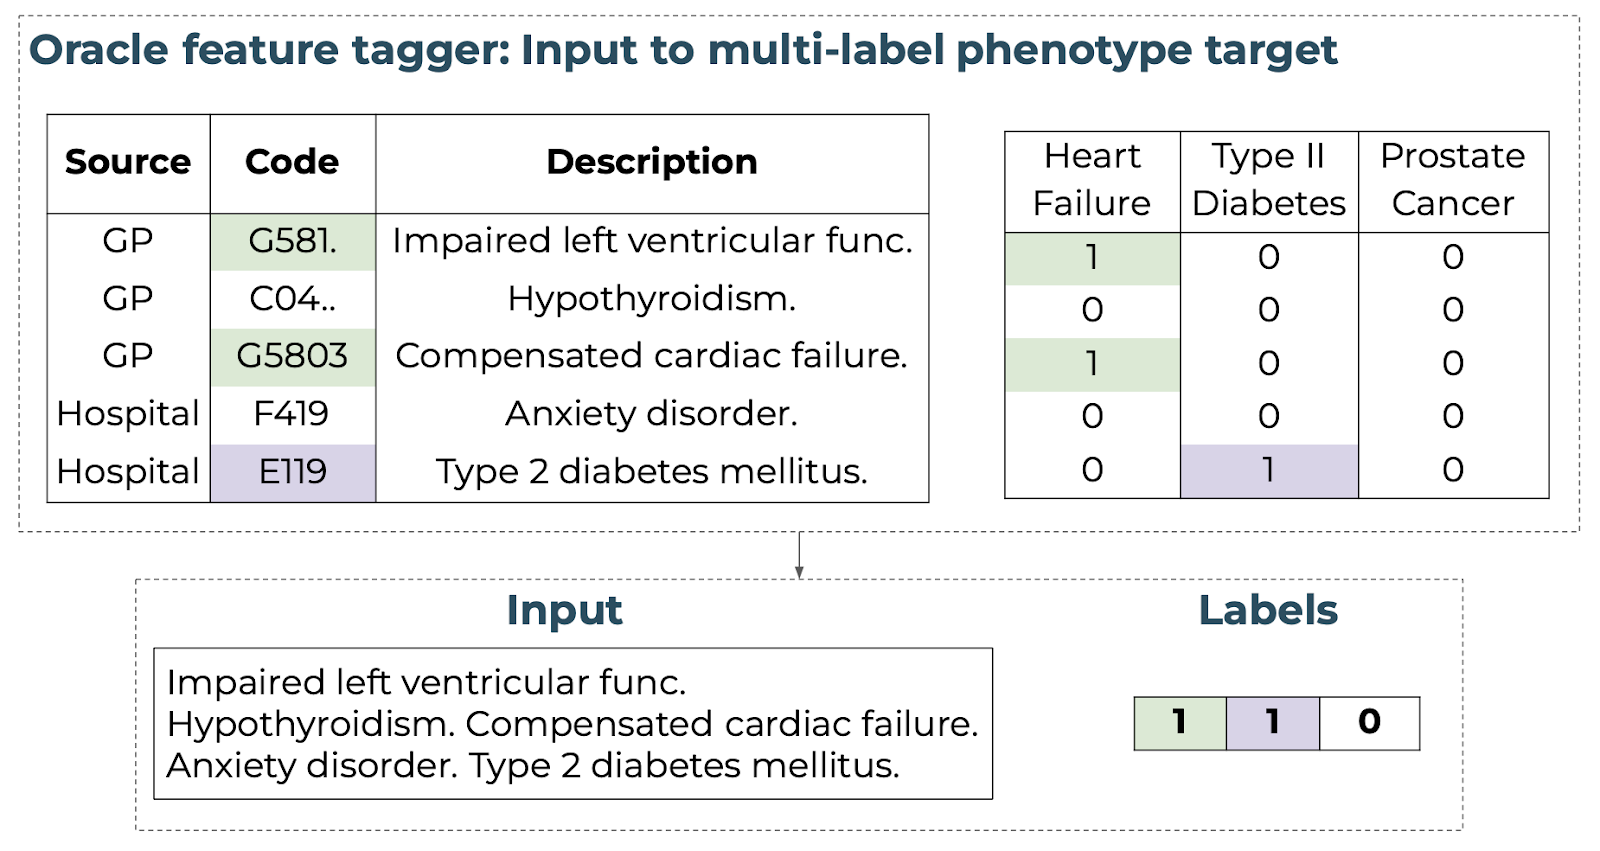
Figure 1. Schematic of mapping a unified clinical history to an input text sequence with multi-label target vector using an oracle annotation.
Clinical masking
To train on the multi-classification task, diagnosed cases are seen as “undiagnosed” by the model. We approach this by masking entire diagnoses for a given positive phenotype as outlined in Figure 2.
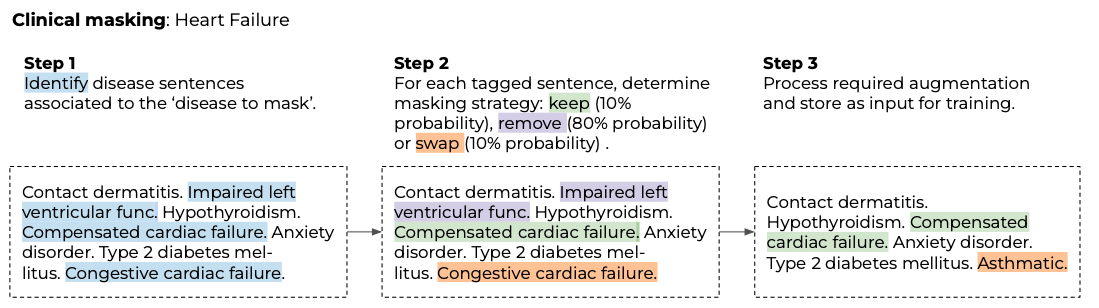
Figure 2. Example of clinical masking approach for a patient with heart failure.
Loss function, comorbidities and prevalences
A patient can have more than one positive label, and these co-occurring conditions are crucial to predict disease, so we want to keep them in the input data, without allowing the model to overfit. We follow a data augmentation approach for multiple positive labels that accounts for these cases. We first replicate and mask one positive phenotype at a time (so each patient has one input per positive label). We define a masking vector which is 1 if the phenotype was masked. Finally, we define a loss weights vector, which is set to 0 if the phenotype is positive and present in the input (label=1), but not masked (masking vector = 0) (Figure 3). We use this loss weights vector to define those comorbidities that are present in the input (positive label) but are not masked (mask=0), so that the model is not allowed to learn from them.
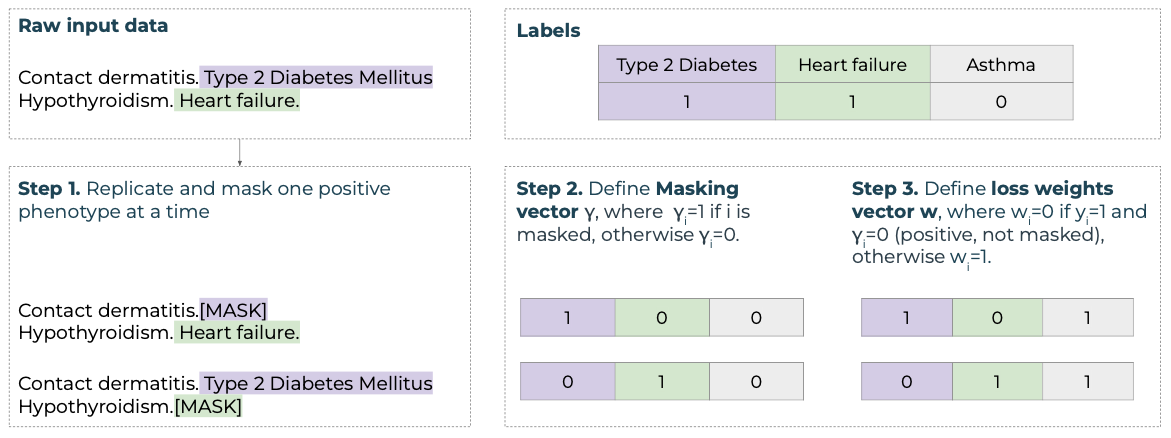
Figure 3. Example of an input sequence containing descriptions relevant to two positive phenotype labels in the target vector y.
Finally, prevalence varies highly across diseases, so our prediction labels are imbalanced (for example, we have more cases with type 2 diabetes mellitus (T2DM) than with breast cancer). We do not want our model to only learn prevalent phenotypes, so we define positive weights per phenotype that give more weight to less prevalent diseases, balancing out across labels. We use a mean-reduced binary cross-entropy loss function over phenotypes, using the defined loss weights and positive weights.
Model design
We train the model in two tasks: on the masked-language model (MLM) task to understand diagnoses, and on the multi-label classification task to predict the probability of having each phenotype per patient. sEHR-CE is then formed by a fine-tuned encoder and a fully connected linear layer as a decoder (Figure 4).
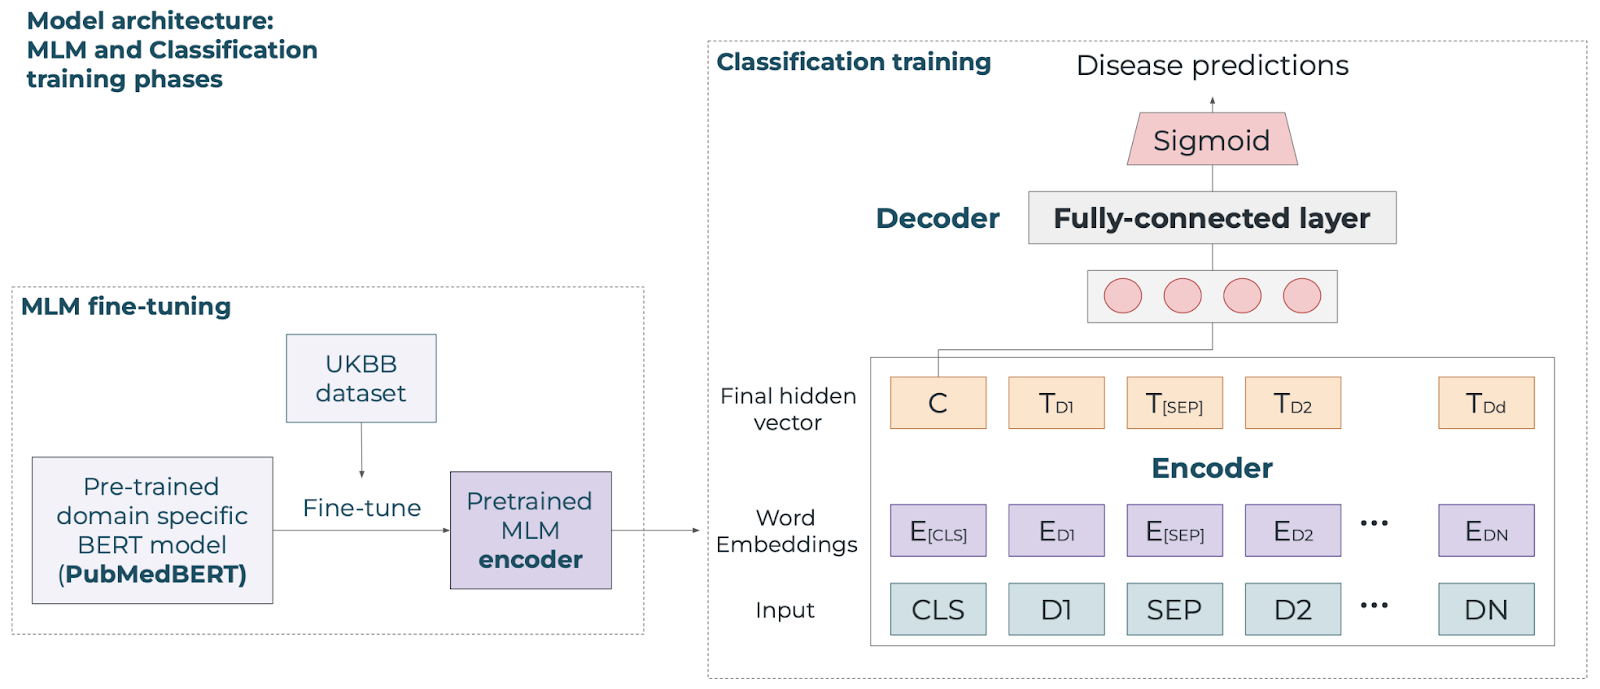
Figure 4. Schematic of the sEHR-CE model for MLM and classification training phases.
Applying our model to type 2 diabetes
This research has been conducted using the UKBB [1] resource under application number 43138, a large-scale study of around 500k individuals. We included individuals with primary and secondary care data, resulting in a cohort of around 155k individuals, and we chose 4 diseases that vary in prevalence and characteristics for our experiments: T2DM, heart failure, breast cancer and prostate cancer. To label patients, we used validated phenotype definitions from CALIBER [2]. We tested the performance of the model on the test set, which were known cases with their diagnosis removed, and sEHR-CE showed the best performance when comparing to baseline models across all phenotypes (average recall of 0.68 and AUCPR of 0.61).
In order to evaluate sEHR-CE’s predictions, we ran a clinical evaluation on T2DM. This allowed us to analyse the potentially new cases, and determine why some cases were easily retrieved, while some others were not. We used sEHR-CE’s predicted probabilities to define five groups: controls, controls with predicted probability higher than 0.85, cases, cases with probability lower than 0.25, and cases with probability higher than 0.985. We looked at haemoglobin A1c (HbA1c), used to diagnose and monitor T2DM, and at the individual genetic risk of developing disease (polygenic risk scores). We found that higher predicted probabilities were associated with higher HbA1c, and higher genetic risk, representing a more severe disease state. Moreover, missed cases were in the pre-diabetic range, meaning they are individuals at risk of developing T2DM.
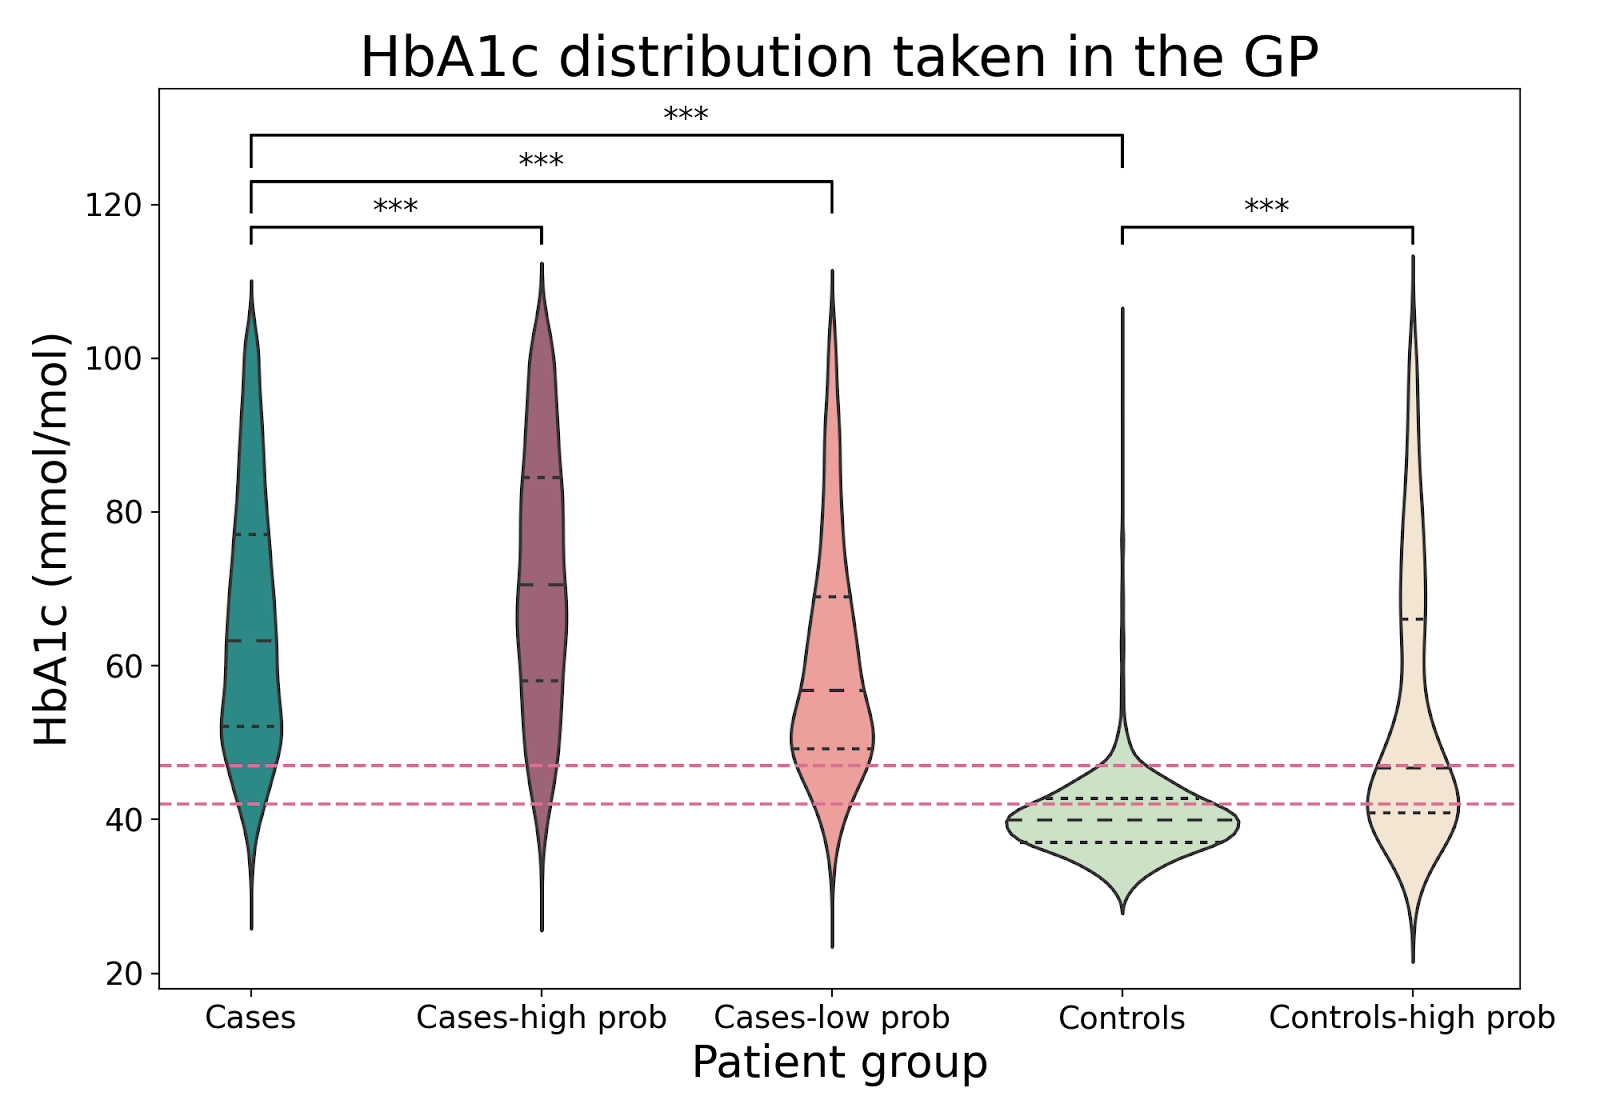
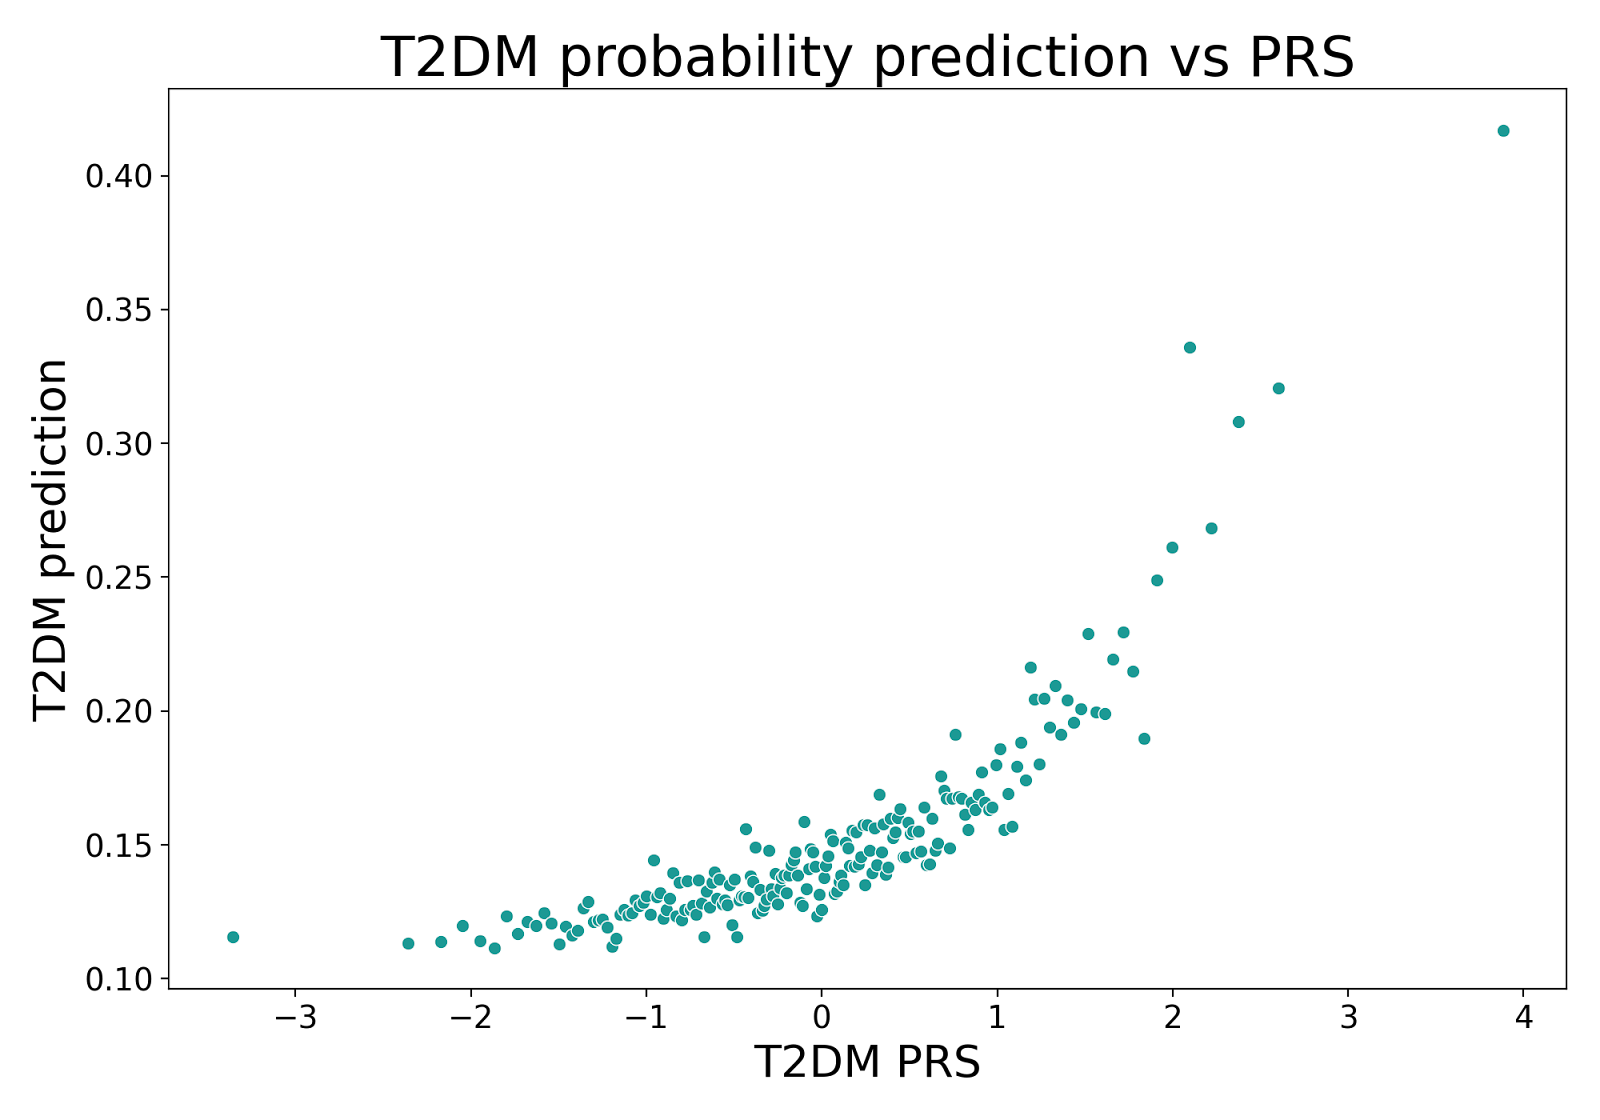
Figure 6. Top. HbA1c distribution across groups in the test sets with diabetes diagnosis ranges shown as dashed lines. Significant p-values are indicated with *** (t-test, α = .001). Bottomt. Median T2DM prediction of individuals in the test sets grouped by the percentiles of the polygenic risk score.
Impact
sEHR-CE is a data-driven method for predicting a clinical outcome (in our case phenotypes) based on language modelling, combining primary and secondary care data. In our evaluation, we have presented a high degree of evidence that we can identify previously undiagnosed individuals, thus extending the original cohort for downstream analysis.
Many studies have shown that drugs with genetic evidence have a higher potential for success in treating patients [3,4]. At BenevolentAI, we run genome-wide association studies (GWAS) to identify genetic loci associated with a particular trait (such as a phenotype or disease). Cohort size is crucial to find significant associations, but some diseases are rare or less prevalent. Using a cohort expansion method such as sEHR-CE can help us extract more meaningful cohorts, increasing the sample size when appropriate, which should improve GWAS results and contribute to new drug development.
References
[1] Sudlow et al. UK Biobank: An open access resource for identifying the causes of a wide range of complex diseases of middle and old age. PLoS Medicine, 12, 1–10 (2015)
[2] Kuan, et al. A chronological map of 308 physical and mental health conditions from 4 million individuals in the English National Health Service. The Lancet Digital Health, 1(2):e63–e77, 2019.
[3] Nelson et al. The support of human genetic evidence for approved drug indications. Nature Genetics 47, 856–860 (2015)
[4] King et al. Are drug targets with genetic support twice as likely to be approved? Revised estimates of the impact of genetic support for drug mechanisms on the probability of drug approval. PLoS Genetics 15, e1008489 (2019)
PUBLICATION
sEHR-CE: Language modelling of structured EHR data for efficient and generalizable patient cohort expansion
Back to blog post and videos